‘Bending the Curve’ in Healthcare Spending
When a politician stands before us and announces a plan to “cut healthcare costs” by “x” billion over 10 years, what exactly does that mean?
There have been moments, as I’ve traveled the path of my policy education, which have rendered some true epiphany. Where things have crystallized, from amorphous gas to tangible solid.
The concept of “Bending the Curve” is one such moment.
Government expenditures can a be true challenge to comprehend, given that numbers are tossed around in ranges that are practically fairy tale to almost everyone. Where clarifications come in the form of, “That’s trillion, with a ‘t’.”
Let me throw out some numbers to you:
Currently, the federal debt sits at about $15 trillion. This is the money that the United States government owes. It is conveniently, and entertainingly, estimated here.
The gross domestic product (GDP): also, about $15 trillion. This is the amount of money, ostensibly, that is spent on goods and services in the United States annually. Here’s a nice chart, from the World Bank. Paul Ryan and his House Committee on the Budget have also demonstrated, with a chart and video, their view comparing GDP with Federal Debt.
National health expenditures - the component of GDP that parses out healthcare - currently sit at about $2.7 trillion. Here are the CMS numbers, with available finer details.
President Obama had a budget for FY 2012 of about $3.7 trillion, which has been anticipated to add $1.7 trillion to the debt (making it about $17 trillion). The New York Times has an easy guide here.
Putting these numbers into light perspective: If you were to be a billionaire a hundred times over, you still would barely register as a decimal point.
I’ll say that I consider these, and a few others, to be important numbers that are worth your memorizing. They put almost all other statistical references into perspective, and allow you to gauge and compare true value, to yourself and to society as a whole. Public health and policy is nothing without denominators. You will be hearing these numbers much more frequently in my future posts.
So what do these numbers have to do with “Bending the Curve”?
When a politician stands before us and announces a plan to “cut healthcare costs” by “x” billion over 10 years, what exactly does that mean?
I’m going to put this into an anecdote with fake numbers, pulled from my head for ease of illustration.
Say we are spending $1 billion dollars a year on healthcare.
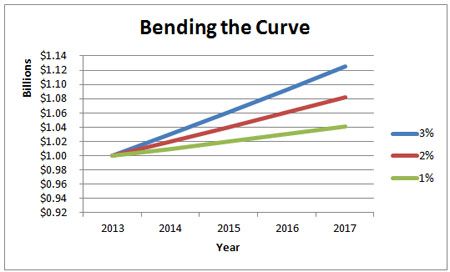
Upon this comes an estimate, driven by history and experts, which suggest that healthcare expenditures will increase by a percentage over time. Let’s say, 3 percent per year.
Remember - this is counterintuitive to healthcare, but an absolute necessity in any industry looking for “growth” - that increased spending in an industry is considered good. GDP going up is good. GDP going down? That’s a recession.
So, next year, we are planning to spend $1,030,000,000 on healthcare. An extra $30 million; and then an additional 3 percent per year thereafter.
Joe Politician then announces a great new plan that will “decrease spending by $10 million next year.” The actual decrease is about 1 percent of the total (2 percent, instead of 3 percent), but 33 percent of the projected spending.
Here is the general rub: Joe Politician’s announcement, his (or her) proclamation of decreasing costs, is actually an estimate on top of the existing estimate. He is saying that expenditures will only increase by $20 million next year. He is “Bending the Curve”; he is slowing the rate of rise.
These numbers are then extrapolated over time, allowing someone to proclaim that by decreasing annual increases from 3 percent to 2 percent, her idea will “save” society $40 million over five years.
And the smoke and mirrors of the whole thing is that there can be little true accuracy with this projection upon a projection. It is a somewhat educated guess upon a somewhat educated guess. The numbers of variables that can obviate the whole conversation are stunning.
I’ve made a chart to represent the hypothetical numbers above, and including a 3 percent-to-1 percent decrease as well:

Epiphany, anyone?
Find out more about Bryan Fine and our other Practice Notes bloggers.
The Role of Third-Party Financing in the Health and Wellness Payment Landscape
April 17th 2025"How patients access and seek out health and wellness care continues to evolve amid growing costs and a changing healthcare landscape – and communication around payment options continues to impact how patients select their provider. In this whitepaper, Synchrony shares new data on the vital role alternative payment options have on patient decisions, and how providers can strengthen their financial offerings. Learning Objectives: • Learn the current trends impacting the ability of in-house financing plans to meet patient demands. • Understand patients’ financing preferences and how it directly impacts behaviors when pursuing care and choosing a provider. • Discover how third-party financing can support practices to meet patients’ needs, help relieve administrative burdens, and stay competitive within an ever-evolving healthcare industry. "